Students explore the concept of linear relationships, as described by tables with graphs.
Prerequisites |
None |
||||||||||||||||||
Relevant Standards |
Select one or more standards from the menu on the left (⌘-click on Mac, Ctrl-click elsewhere). Oklahoma Standards
|
||||||||||||||||||
Lesson Goals |
Students will be able to…
|
||||||||||||||||||
Student-facing Lesson Goals |
|
||||||||||||||||||
Materials |
|||||||||||||||||||
Preparation |
|
||||||||||||||||||
Key Points for the Facilitator |
This lesson is about two big ideas: * Connecting representations of Tables and Graphs * Lines are made of points (try to avoid refering to "lines" as much as "collections of points") * Linear relationships, defined as rules that generate one value from another. These rules form straight lines on a graph and sequences that change at a constant rate in a table |
||||||||||||||||||
Language Table |
|
- linear
-
a rule that computes one quantity from another, which can be graphed as straight line or written as a sequence of numbers that change at a constant rate
🔗Simple Sequences and Straight Lines 35 minutes
Overview
Students explore the concept of linearity, as represented in tables and graphs.
Launch
Take a look at the following rows in a table and points on a graph:
|
-
What do you Notice?
-
What do you Wonder?
Each row in the Table represents an (x, y) point on the graph. The "x" column is a list of positions along the x-axis, and the "y" column is filled with values that are computed from those position according to some rule.
Can you predict the next two rows in the table? The next points on the graph? How did you arrive at your prediction?
Both the y-column in the table and the y-coordinates on the graph follow a rule, which dictates how y relates to x. We expect that rule to continue no matter what x is, continuing the line straight in both directions, and the sequence of values in the table to increase or decrease at a constant value for every additional row.
Linear Relationships: Sequences that change at a constant rate, or points forming a straight line on a graph.
Rules that behave this way are called linear relationships. If the rule for a table says the y-values always change by the same amount between x-values, it’s linear. If the rule says that y-coordinates always change by the same amount between x-coordinates - drawing a straight line on the graph - it’s linear.
Linear relationships are everywhere:
-
A car is traveling at 50 miles per hour
-
Milk costs $2.50 per gallon
-
There are 18 wheels per tractor-trailer
-
A tree grows 2 inches per year
-
There are 30 students per teacher
What other linear relationships can you think of?
We can imagine of a horizontal, straight-line relationship where y = 3 ("for all values of x, y is three"). We can even imagine a vertical, straight-line relationship where x = 3y ("for all values of y, x is three").
Linear Functions: linear rules that only work from x to y.
A linear relationship can exist from x-to-y, or from y-to-x. But a linear function is strictly x-to-y. We can also describe this as "input-to-output", or "Domain to Range." Not all linear relationships are linear functions! Linear functions can only have one possible y-value for a single x-value, so our horizontal line fx = 3 can be written as a function but our vertical line fy = 3 cannot.
Investigate
Look at the two "sideways" data tables below.
|
|
-
What do you Notice?
-
What do you Wonder?
-
Can you figure out what the next (x,y) pair should be for each of them?
-
Can you guess what the y-value for each table would be when x is 0?
We can think of the "x" column as counting the order in which the y-values appear (1st value, 2nd value, etc). The "y" column, on the other hand is computed from the x-values according to some rule (or function!).
When there is a linear relationship, the y-values change at a constant rate. If we were to graph those values, all of the points would fall on a straight line.
-
Complete Matching Tables to Graphs (Desmos).
-
Optional: Complete Matching Tables to Graphs.
Pedagogy Note To encourage students to look at the points in the table and graph, it is useful to change the scale of the graphs so that all lines look the same. This prevents students from leaning on visual cues like "steepness" to bypass the learning objective. It can also be useful to list the points in the table out of order, both to focus students' attention on the points and to drive home that rows do not have to be ordered! |
Axes on a graph need an order. Rows in a table don’t!
The rows in a table are discrete. They preserve their meaning if the rows are shuffled into a different order. Ordering the rows in a table can make it easier for us to find the rule or function.
In a graph, the points on the x-axis cannot be shuffled, because the x-axis must always be ordered. We can stretch the scale of the axes to making the lines look different, but the points will always be in the same order.
Can you match tables and graphs, even if the rows are shuffled and the axes are changed? Complete Matching Tables to Graphs 2.
Synthesize
Linear relationships show up all the time in real life, so it’s helpful to know how to think about them. We’ve seen that linear relationships can be represented as tables and graphs. Tables only show us some points on a line, whereas a line itself is made up of an infinite number of points. When a table represents a sample of some larger trend, the graph is a way of seeing the trend itself.
🔗Linear, Non-Linear, or Bust! 20 minutes
Overview
Students deepen their understanding of linearity, by seeing counterexamples (non-linear relationships), as well as tables and graphs for which there is no relationship.
Launch
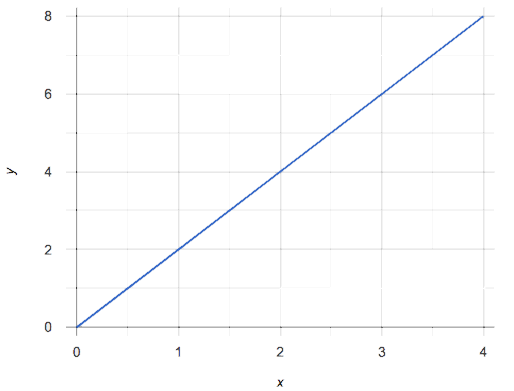
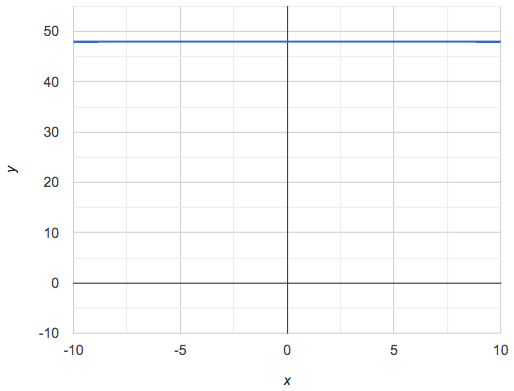
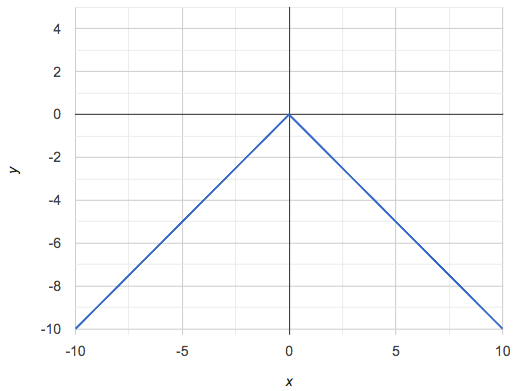
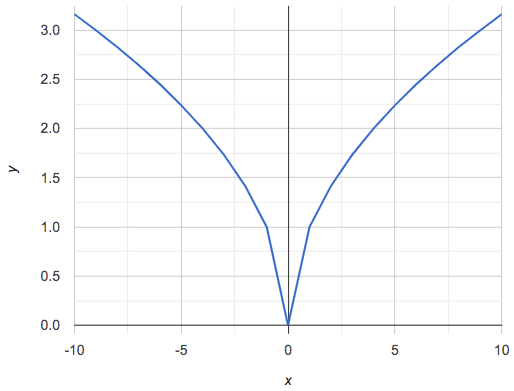
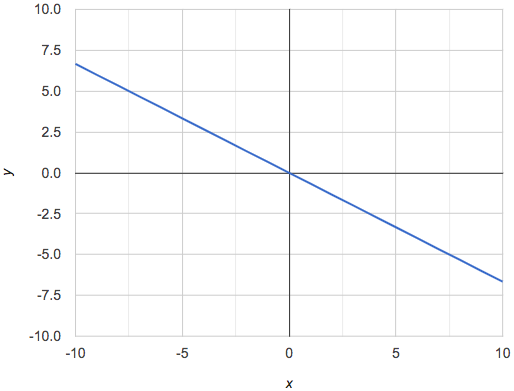
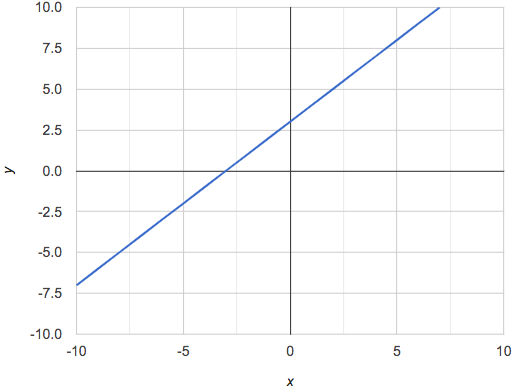
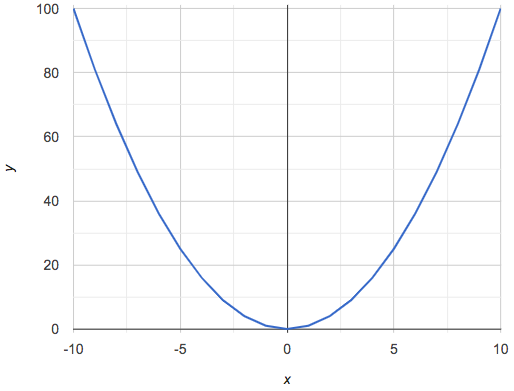
If all linear relationships can be shown as points on a graph, does that mean all graphs are linear? Look at the six graphs shown below:
-
What do you Notice?
-
What do you Wonder?
Three of the graphs above show linear functions, and three show other, non-linear functions. As we can see, the linear graphs can be perfectly horizontal, slope upwards and to the right, or slope downwards to the right. NOTE: there are still clearly patterns in the non-linear relationships — they just aren’t linear!
Linear relationships in a graph always appear as straight lines
If all linear relationships can be shown as a tables, does that mean all tables are linear? Look at the six tables shown below:
|
|
||||||||||||||||||||||||
|
|
||||||||||||||||||||||||
|
|
-
What do you Notice?
-
What do you Wonder?
-
Can you figure out what the next x,y pair should be for each of them?
-
Can you guess what the y-value for each table would be when x is 0?
Three of the tables above show a linear function, and three show other, non-linear functions. As we can see, the linear tables can have y-values that change by zero (no change), by a positive number (constant increase), or a negative number (constant decrease). NOTE: there are still clearly patterns in the non-linear relationships — they just aren’t linear!
Linear relationships in a table show up as sequences that change at a constant rate. The y-value when x is zero is also the value where the line will cross the y-axis.
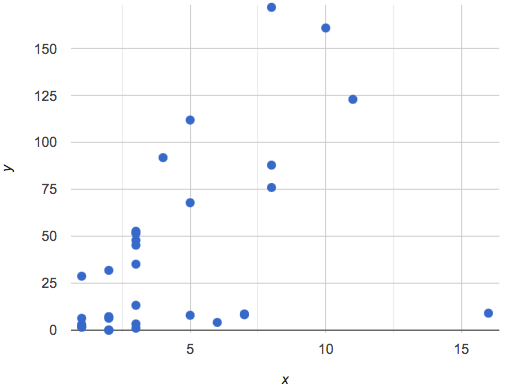
Sometimes there is no function that will give us a particular table or graph! Take a look at the table and points below. Can you predict the next two rows? Where will the next point be?
|
PRO TIP: If there are two different y values for the same x, it can’t be a function! Think back to our vertical line fy = 3: x is three all the time, for an infinite number of y-values. If multiple y-values come from the same x-value, we know it’s not a function.
🔗Investigate
Can you tell when a relationship is a linear function? A non-linear one? Not a function at all?
-
Complete Linear, Non-Linear or Bust?
-
Complete Graphs: Linear, Non-Linear or Bust?
Synthesize
Data has a "shape", and this shape can emerge when we look for patterns in that data. A linear function is one kind of pattern, and we can see it when viewing data as a table or a graph.
🔗Additional Exercises:
These materials were developed partly through support of the National Science Foundation,
(awards 1042210, 1535276, 1648684, and 1738598).  Bootstrap:Integrated Oklahoma by the Bootstrap Community is licensed under a Creative Commons 4.0 Unported License. This license does not grant permission to run training or professional development. Offering training or professional development with materials substantially derived from Bootstrap must be approved in writing by a Bootstrap Director. Permissions beyond the scope of this license, such as to run training, may be available by contacting contact@BootstrapWorld.org.