(Also available in Pyret)
Students learn how standard deviation serves as Data Scientists' most common measure of "spread": how far all the values in a dataset tend to be from their mean. When we looked at box plots, we visualized spread based on range and interquartile range. Now we’ll return to histograms and picture the spread in terms of standard deviation.
Lesson Goals |
Students will be able to…
|
Student-facing Lesson Goals |
|
Materials |
|
Supplemental Materials |
|
🔗Measuring "Deviance" 30 minutes
Overview
Students review the notion of spread itself, and build up to the formula by annotating histograms.
Launch
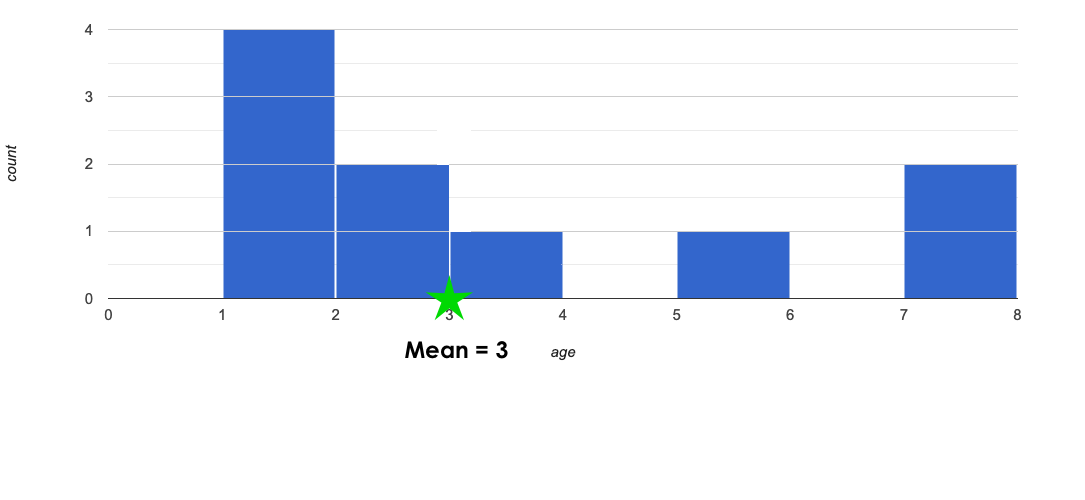
The Animal Shelter Bureau reports that the mean age of shelter cats is 3 years.
Take a look at the Animals Starter File. (You can also look on this page - or if you are using a printed workbook, you’ll find it at the front).
-
Does a mean age of 3 years translate to all of the cats being close to 3 years old? Why or why not?
-
No, we cannot assume all cats are close to 3 years old. There are some outliers in the dataset.
-
In the activity that follows, students will look at ten cats from the shelter to consider the distribution of their ages.
Turn to Computing Standard Deviation, and complete numbers 1-3.
-
What did you get for the mean? Does it match what the Animal Shelter Bureau says?
-
The mean is 3; yes, it matches what the Animal Shelter Bureau says.
-
-
Can you think of four ages, such that their mean is 3 years old?
-
Any four ages that add up to 12 will work!
-
Possibilities include: {1,1,1,9}, {1,1,2,8}, {1,1,3,7}, {1,1,4,6}, {1,1,5,5}, {1,2,2,7}, {1,2,3,6}, {1,2,4,5}, {1,3,3,5}, {1,3,4,4}, {2,2,2,6}, {2,2,3,5}, {2,2,4,4}, {2,3,3,4}, {3,3,3,3}
-
-
Can you think of a different spread of four ages that would have the same mean?
-
See above.
-
-
How many different sets of four ages can you think of, which all have a mean of 3?
-
15. See above.
-
Without a measure of spread, just knowing the mean doesn’t tell us enough about the shape of the data.
When summarizing a column, we’d like to use a measure that gathers data from every value. We already have one method of measuring spread: calculating the Five Number Summary and using it to generate a box-plot.
Unfortunately, that measure comes from only a small number of data points! If possible, we’d like to have a measure that summarizes the spread across all the points.
Instead of focusing on the handful of data points used in our Five Number Summary, another way to measure spread is to focus on the "typical" distance from the mean. In other words, we want to know what kind of deviation is "standard" for all the points.
Standard deviation is the most useful way to summarize spread of a quantitative column.
Investigate
 We could imagine a shelter where every cat is between 2 and 4, so each cat only deviates from the mean by 1 year! But we could also imagine a shelter with only kittens and very old cats, where cats deviate by as much as 10 years from the mean!
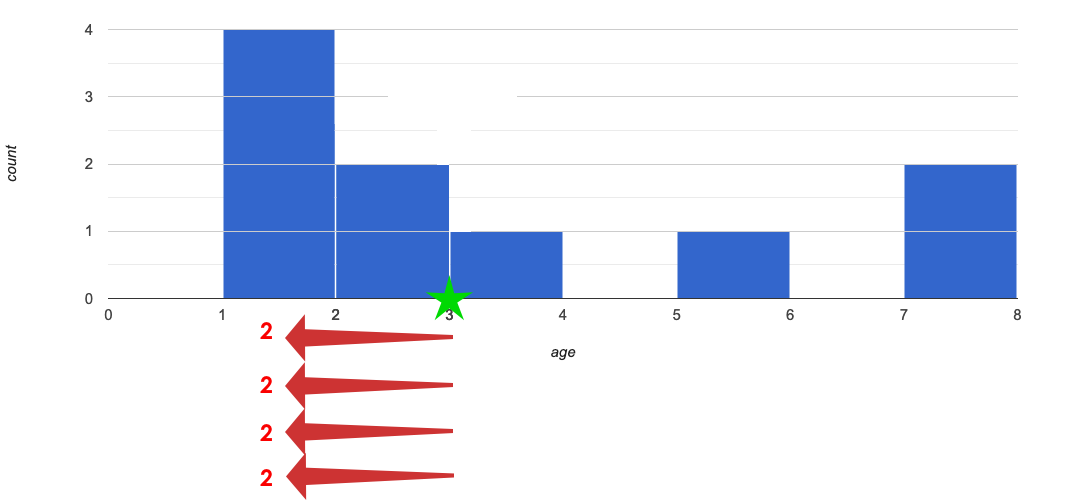
How far away is each data point from 3?
 In this image, we’ve draw an arrow for each of the 1-year-old cats. That means there are four arrows running from the mean at 3 to the interval at 1, and each arrow has the label 2.
Complete numbers 4 to 6 of Computing Standard Deviation.
Mean Average Deviation?
In this section of the worksheet, students will need to stretch their visual imaginations a bit! In problem number 6, they are asked to summarize all 10 distances from the mean into a single number. The goal here is for students to make an educated guess about standard deviation (SD) before learning the algorithm for computing it. Invite and encourage discussion about students' different approaches for guessing at the best summary number before sharing the key idea about standard deviation!
Students are likely to hone in on the Mean Average Deviation, or MAD. Both SD and MAD measure variability or "spread" by computing individual deviations from the mean, but MAD averages these deviations and SD transforms them via square/square-root.
To compute the standard deviation we add the squares of all N distances, divide by N-1, then take the square root of the result.
The process of finding standard deviation manually is a bit laborious. Keeping organized is crucial; a partially-completed table is provided on the bottom half of worksheet to support students in doing so.
Complete numbers 7-10 of Computing Standard Deviation, where you will utilize the algorithm for computing standard deviation.
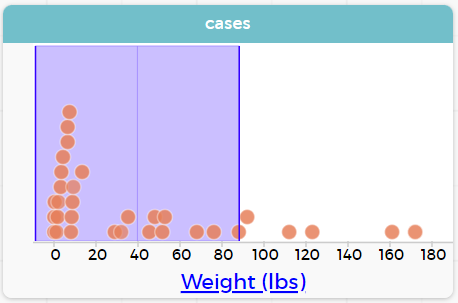
To compute standard deviation in CODAP, create a graph with only one quantitative attribute. Open the Measure menu, then select the button that says "Measures of Spread." (Note that this button only appears when one quantitative attribute displayed.) Selected Standard Deviation. Move your cursor back to the display, and hover over the edge of the purple shading that appears.

-
What is the standard deviation for the weights of all the animals at our dataset?
-
Approximately 48.5
-
For additional practice, have students complete Computing Standard Deviation (2).
Synthesize
-
Can you explain why two datasets can have the same mean, but different standard deviations?
-
Mean is a measure of central tendency, whereas standard deviation measures the variation of some sample.
-
-
What kind of dataset would have a standard deviation of zero?
-
A standard deviation of zero means that every number in the sample is exactly the same.
-
🔗Comparing Standard Deviations 20 minutes
Overview
Students compare centers and (more importantly) spreads - of two quantitative datasets by comparing their histograms. Both mean and standard deviation can be affected by outliers and/or skewness.
Launch
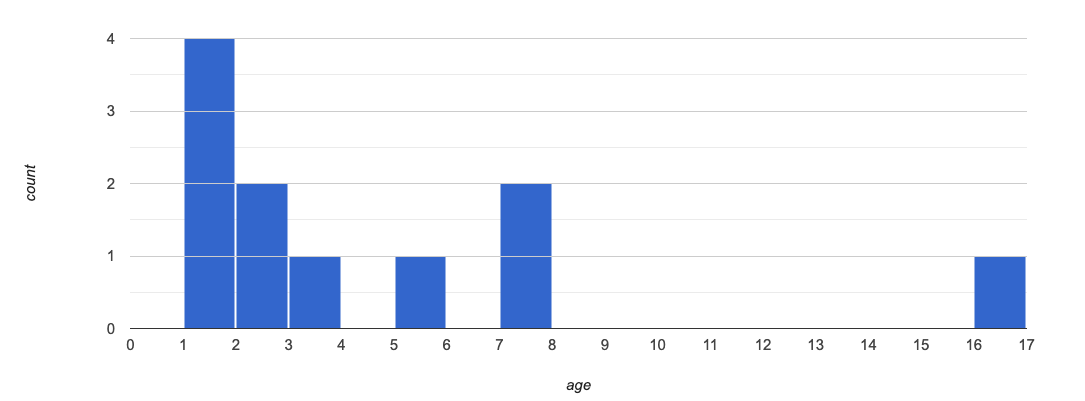
Take a look at the histogram below. It is the same histogram we saw in the previous section, but now with an 11th cat that is 16 years old. That’s quite an outlier!

-
What is the shape of this histogram?
-
The histogram has high outliers, therefore it is skewed right.
-
-
How does it differ from the one we just looked at?
-
The previous histogram - with the 16-year-old cat omitted - was roughly symmetric.
Turn to The Effect of an Outlier to explore the extent to which the inclusion of an outlier will affect the center and spread of a quantitative dataset.
-
What did this outlier do to the mean? Refer back to Computing Standard Deviation to help you.
-
Previously, the standard deviation was ~2.45; now it is ~5.83.
-
-
What did this outlier do to the standard deviation?
-
The outlier caused the standard deviation to increase by ~3.38.
-
Investigate
The mean and standard deviation tell us where the data is centered and how far the data strays from that center. For example, when writing about the ages of cats in our shelter, we might say "the mean age is 3 and the standard deviation is 2.45, so most cats are between the ages of 1 and 5 years old."
The mean time-to-adoption is 5.75 weeks. Does that mean most animals generally get adopted in 4-6 weeks?
Solicit students' ideas, but do not reveal the answer.
Turn to Data Cycle: Standard Deviation in the Animals Dataset to get some practice using the Data Cycle to answer this question, then write your findings in the space at the bottom.
-
How much did adding an outlier change the mean?
-
The standard deviation?
Mean Absolute Deviation (MAD) v. Standard Deviation (SD)
MAD and SD are both measures of "how far from the mean all the points in the dataset are".
-
Mean Absolute Deviation (MAD) flattens each points' deviation into a single "dimension", taking the vertical (y) distance from each point to the mean of all the y-values.
-
Computing the Standard Deviation (SD) involves finding the square root of a sum of squares. That should sound suspiciously like the distance formula! Indeed, computing the SD for a dataset with two points is basically finding the (normalized) length of the hypotenuse of an n-dimensional right pyramid!
Why use one measure of spread instead of the other?
The answer is closely related to the difference between two measures of center! Mean incorporates data from every point, while median does not. However, mean is sensitive to the effect of extreme outliers or skew. In those cases, median is considered to be the better measure of center. Treating each point independently allows each deviation to contribute to the measure of spread, just as mean computes the measure of center.
Standard Deviation is used most often, but like mean it is sensitive to extreme outliers or skew. When there are extreme outliers, the Mean Absolute Deviation is considered a better measure of spread.
Extreme values affect both the mean and standard deviation of a dataset.
-
Unusually low values decrease the mean, while unusually high values increase it.
-
Unusually low or high values increase the standard deviation, because it summarizes distance from the mean in either direction.
Synthesize
Why is it useful to know the standard deviation of a dataset?
🔗Data Exploration Project (Standard Deviation) flexible
Overview
Students apply what they have learned about standard deviation to their chosen dataset by completing the final row of the "Measures of Center and Spread" table in their Data Exploration Project Slide Template and adding the standard deviation for two quantitative columns. They will also interpret the standard deviations they found, and record any interesting questions that emerge.
Visit Project: Dataset Exploration to learn more about the sequence and scope. Teachers with time and interest can build on the exploration by inviting students to take a deep dive into the questions they develop with our Project: Research Capstone.
Launch
Let’s review what we have learned about standard deviation.
-
Do we compute standard deviation with categorical data or quantitative data? How many columns of data does standard deviation tell us about?
-
Standard deviation is a measure that tells us about the spread of a single quantitative column of data.
-
-
Standard deviation is a measure of spread. In your own words, what does spread mean?
-
Spread is the extent to which values in a dataset vary, either from one another or from the center.
-
-
How can two datasets have the same mean, but different standard deviations?
-
Mean is a measure of central tendency, whereas standard deviation measures the variation of some sample.
-
-
Both unusually low and unusually high values (outliers) increase the standard deviation. Explain why.
-
Standard deviation summarizes distance from the mean in either direction.
-
Investigate
Let’s connect what we know about standard deviation to your chosen dataset.
Reminder: Students have the opportunity to choose a dataset that interests them from our List of Datasets in the Choosing Your Dataset lesson.
-
Open your chosen dataset starter file in CODAP.
-
Remind yourself which two columns you investigated in the Measures of Center lesson and use CODAP to compute the standard deviation for one of them.
Consider recommending that students choose the same column they used when they found their Measures of Center. If students use a different column, they will need to copy/paste additional slides into their slide deck.
-
What question does your computation answer?
-
Possible responses: How is the data for a certain column distributed? How does the standard deviation compare to the mean?
-
-
Write down that question in the top section of the Data Cycle: Standard Deviation in My Dataset.
-
Complete the rest of the data cycle, recording how you considered, analyzed and interpreted the question.
-
Repeat this process for the other column you explored before (and any others you are curious about).
If students want to investigate new columns from their dataset, they will need to copy/paste additional Measures of Center and Spread slides into their Exploration Project and calculate the mean, median, modes and 5-number summaries for the new columns.
Invite students to discuss their results and consider how to interpret them.
It’s time to add to your Data Exploration Project Slide Template.
-
Locate the "Measures of Center and Spread" section of your Exploration Project. Type the standard deviations you just identified into the tables for the corresponding columns.
-
Now, add your interpretations of the standard deviations and record any questions that emerged in the "My Questions" section at the end of the slide deck.
Synthesize
Have students share their findings.
-
Did you discover anything surprising or interesting about your dataset?
-
What questions did the standard deviations inspire you to ask?
-
Were there any surprises when you compared your findings with other students?
These materials were developed partly through support of the National Science Foundation, (awards 1042210, 1535276, 1648684, 1738598, 2031479, and 1501927).  Bootstrap by the Bootstrap Community is licensed under a Creative Commons 4.0 Unported License. This license does not grant permission to run training or professional development. Offering training or professional development with materials substantially derived from Bootstrap must be approved in writing by a Bootstrap Director. Permissions beyond the scope of this license, such as to run training, may be available by contacting contact@BootstrapWorld.org.
