(Also available in WeScheme)
Students explore the concept of slope and y-intercept in linear relationships, using function definitions as a third representation (alongside tables and graphs).
Lesson Goals |
Students will be able to…
|
Student-facing Lesson Goals |
|
Materials |
|
Supplemental Materials |
|
Key Points for the Facilitator |
|
- coordinate pair
-
a set of numbers describing an object’s location on the coordinate plane
- dependent variable
-
When modeling a relationship between an input and an output (e.g. - distance over time), we are curious about how a change in the input (typically graphed on the x-axis) impacts the output (y). When the output is entirely dependent on the input, we refer to the output as the "dependent variable".
- domain
-
the type or set of inputs a function expects, i.e., the independent variable(s) that govern the output of the function
- independent variable
-
When modeling a relationship between an input and an output (e.g. - distance over time), we are curious about how a change in the input (typically graphed on the x-axis) impacts the output (y). When the output is entirely dependent on the input, we refer to the input as the "independent variable".
- range
-
the type or set of outputs that a function produces, i.e., the dependent variable(s)
- slope
-
the steepness of a straight line on a graph reported as a number which tells how much y changes for every unit increase in x
- y-intercept
-
the point where a line or curve crosses the y-axis of a graph
🔗Defining Linear Functions 35 minutes
Overview
Students explore function definitions as a way of expressing linear relationships, and construct tables and graphs from those definitions.
Launch
As you’ve seen, a function definition is a way of summarizing a relationship between an independent variable (𝑥) and a dependent variable (𝑦). You’ve seen how a linear relationship can be expressed as a table or graph. But what do these kinds of relationships look like as a definition?
Linear functions are defined by their slope and y-intercept.
Here we see a function definition written using pyret notation and using function notation.
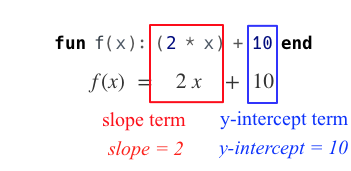
The slope-intercept form of the line includes the slope as the coefficient of x, and the y-intercept as the numerical term. You will hear people describe this form as 𝑦 = 𝑚𝑥 + 𝑏, where 𝑚 stands for slope and 𝑏 stands for the y-intercept.
While it is common to write the x-term first and the y-intercept second, they can be written in any order!
| Function Notation | Pyret Code |
|---|---|
𝑓(𝑥) = 6𝑥 − 10 |
|
𝑓(𝑥) = −10 + 6𝑥 |
|
When the slope is zero (and the line is horizontal)… we may choose whether or not to write the slope term.
| "Visible" Slope | "Invisible" Slope |
|---|---|
𝑓(𝑥) = 0𝑥 + 22 |
𝑓(𝑥) = 22 |
When the y-intercept is 0 (and the line crosses the y-axis at the origin)… we may choose whether or not to write the slope term.
| "Visible" y-intercept | "Invisible" y-intercept |
|---|---|
𝑓(𝑥) = 3.2𝑥 + 0 |
𝑓(𝑥) = 3.2𝑥 |
To check our work, we can apply the function to the x-value from any coordinate pair on our table or graph, and it should produce the y-value!
As with tables and graphs, a function definition can also reveal whether or not the function is linear. Functions that are not linear will follow other forms, for example they may include exponents or absolute values.
Investigate
Let’s start by identifying the slope and y-intercept from function definitions.
Let’s connect definitions to tables and graphs.
Writing down the slope and y-intercept beneath each representation will help!
Let’s write our own definitions from tables and graphs!
Common Misconceptions
It is common to think of the graph as the "output" of the function, rather than the function itself. Most math textbooks will use language like "matching the graph to the function", suggesting that the graph is somehow not the function! Since this language is pervasive, it’s important to actively push against it.
Synthesize
What strategies did you use?
Function definitions are a way of talking about relationships between an independent variable and a dependent variable: milk costs $0.59/gallon, a stone falls at 9.8𝑚/𝑠2, or there are 30 students for every teacher at a school. If we can figure out the relationship between a small sample of data, we can make predictions about what happens next. We can see these relationships as tables, graphs, or symbols in a definition. We can even think about them as a mapping between Domain and Range!
When we talk about functions, it’s helpful to be able to switch between representations, and see the connections between them.
🔗Finding the y-intercept from the Slope and a Point 20 minutes
Launch
Consider the function 𝑓(𝑥) = 3𝑥.
x |
0 |
1 |
2 |
3 |
y |
0 |
3 |
6 |
9 |
-
What is the slope?
-
3
-
-
What is the y-intercept?
-
0
-
-
What is the y-value when x = 2?
-
6
-
Anytime the y-intercept is 0, we can multiply any x-value by the slope to get its corresponding y-value.
But if the y-intercept isn’t zero… there is another step to finding the y-value.
Consider the function 𝑓(𝑥) = 3𝑥 − 2.
x |
0 |
1 |
2 |
3 |
y |
-2 |
1 |
4 |
7 |
-
What is the slope?
-
3. Same as for the previous function.
-
-
What is the y-intercept?
-
-2
-
-
What is the y-value when x = 2?
-
4. Two less than the y-value for 𝑥=3 in the previous function, where the y-intercept was 0.
-
The y-intercept always gets added to / subtracted from the product of the slope and the x-value to find the corresponding y-value.
Investigate
As discussed above, the relationship between the x-values and the y-values can be described using 𝑦 = 𝑚𝑥 + 𝑏, where 𝑚 stands for slope and 𝑏 stands for the y-intercept.
If we solve that for the y-intercept…
𝑏 = 𝑦 − 𝑚𝑥
In other words, the y-intercept can be calculated by subtracting the product of the slope and any x-value from the corrseponding y-value.
Let’s say the slope is 3. And we know that the line passes through the point (7,9).
-
𝑏 = 𝑦 − 𝑚𝑥
-
𝑚 = 3
-
𝑥 = 7
-
𝑦 = 9
To find the y-intercept, subtract 9 (the y-value of the point) minus 3 × 7 (the product of the slope and the x-value of the point).
-
𝑏 = 9 − 3(7)
-
𝑏 = 9 − 21
-
𝑏 = −12… we found our y-intercept!
We can now use the slope and y-intercept to write our function definition:
-
𝑓(𝑥) = 3𝑥 − 12
Consider the table below.
x |
80 |
81 |
82 |
83 |
y |
150 |
155 |
160 |
165 |
-
What is the slope?
-
5
-
-
Calculate the y-intercept using the first coordinate pair.
-
𝑏 = 𝑦 − 𝑚𝑥
-
𝑏 = 150 − 5(80)
-
𝑏 = 150 − 400
-
𝑏 = −250
-
-
Do you get the same y-intercept if you use another pair?
-
Yes.
-
🔗Additional Practice
We also have three Pyret starter files for additional practice with:
These materials were developed partly through support of the National Science Foundation, (awards 1042210, 1535276, 1648684, 1738598, 2031479, and 1501927).  Bootstrap by the Bootstrap Community is licensed under a Creative Commons 4.0 Unported License. This license does not grant permission to run training or professional development. Offering training or professional development with materials substantially derived from Bootstrap must be approved in writing by a Bootstrap Director. Permissions beyond the scope of this license, such as to run training, may be available by contacting contact@BootstrapWorld.org.