Students learn to generate and compare dot plots and bar charts, explore other plotting and display functions in CODAP, and (optionally) design an infographic.
Lesson Goals |
Students will be able to:
|
Student-facing Lesson Goals |
|
Materials |
|
Supplemental Materials |
|
Supplemental Resources |
- bar chart
-
a display of categorical data that uses bars positioned over category values; each bar’s height reflects the count or percentage of data values in that category
- categorical data
-
data whose values are qualities that are not subject to the laws of arithmetic
- quantitative data
-
number values for which arithmetic makes sense
🔗Displaying Categorical Variables 10 minutes
Overview
Students use the options on CODAP’s Configuration and Measure menus to produce displays of the Animals Dataset.
Launch
Where have you seen infographics and graphs used to display data in the real world?
Solicit student responses, and then share with them that today’s lesson is all about producing displays in CODAP. Explain that, as a class, you’ll walk through some of the basic mechanics of creating a display - and then students will have the opportunity to independently create and explore displays in CODAP.
-
Open Animals Starter File in CODAP.
-
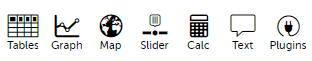
Click the
graphicon from the horizontal toolbar in the upper left. (See screenshot below.) What appears?
-
Select a dot with your mouse. What happens?
-
The dot turns blue, and the corresponding row in the table is highlighted.
-
-
What happens when you select a table row? How about multiple table rows?
-
The corresponding dot(s) turn blue.
-
-
What happens when you click the "eye" icon (to the right of the graph or the table, depending on which is selected)?
-
A menu appears.
-

Note: If students report that a blank graph appears (rather than a scatter plot), make sure CODAP is whitelisted on the browser’s ad-blocker. Don’t worry - CODAP never advertises to users!
Until we assign variables for the axes, the data points are randomly distributed on the graph.
Hovering over an orange dot reveals the name of that particular animal. Selecting a particular dot causes the table row for that animal to be highlighted in blue. Holding the shift button allows students to select multiple dots in the graphical display, or multiple rows in the table.
Students should observe that when they select a table row (or multiple table rows), the corresponding dots change color. When they set aside selected and / or unselected cases (by using the "eye" icon), they can temporarily alter the amount of pets in the dataset (with the option to restore to the original dataset).
Students can also resize the window by dragging its borders.
Investigate
Once we have a graph of randomly distributed data points, we can organize the data by selecting attributes from our table that we want to appear on the axes of our graph.
-
Practice manipulating the data by completing Dot Plots and Bar Charts in CODAP.
-
Optional: to dig deeper into bar charts, have students turn to Bar Chart - Notice and Wonder.
Dot plots and bar charts look pretty similar. Why would we opt to use one over the other?
Dot plots are best for smaller datasets. If we anticipate that there will be fewer than about 10 rows per category, a dot plot works well. We will be able to clearly, easily identify the number of dots in each category, even though there are no values or intervals on the y-axis.
Bar charts work well for large datasets. It would be very inconvenient to draw a display with five million dots! If we opt to use a bar chart rather than a dot plot, we can simply adjust the intervals on the y-axis to meet our needs. For instance, we could determine that a one-centimeter bar represents one million rows of our dataset.
The image below shows a dot plot for a large dataset next to a dot plot for a small dataset. The plot for the large dataset is basically useless!

Categorical data is used to classify, rather than to measure. Only when data is being treated categorically will you be invited to fuse data points - transforming a dot plot into a bar chart. Quantitative (or numeric) data must measure or compare; it is subject to the laws of arithmetic.
People aren’t Hermaphrodite?
When students make a display of the |
Common Misconceptions
Bar charts look a lot like another kind of display - called a "histogram" - which displays numeric data, not categorical.
Creating each of these displays begins the same way: we create a dot plot, and then modify it using CODAP’s menus. Depending on what type of data the dot plot displays, we can transform it into either a bar chart (for categorical data), or a histogram (for numeric data). These displays serve unique purposes!
Pie charts display categorical data, too, but CODAP doesn’t offer them largely because many find them challenging to read.
Synthesize
Bar charts display how much of the sample belongs to each category. If they are based on sample data from a larger population, we use them to infer the proportion of a whole population that might belong to each category.
Bar charts are mostly used to display categorical columns.
While bars in bar charts should follow some logical order (alphabetical, small-medium-large, etc), they can technically be placed in any order, without changing the meaning of the chart.
Mini Project: Making Infographics Infographics are a powerful tool for communicating information, especially when made by people who actually understand how to connect visuals to data in meaningful ways. Optional Project: Making Infographics [rubric] is an opportunity for students to become more flexible math thinkers while tapping into their creativity. This project can be made on the computer or with pencil and paper. There’s also an Infographics Rubric to highlight for you and your students what an excellent infographic includes. |
🔗Exploring Other Displays 30 minutes
Overview
Students explore the CODAP data display options available to them. In doing so, they experiment with new charts and get comfortable with CODAP as a platform for doing data science.
Launch
There are lots of different kinds of charts and plots that we can build in CODAP! Explain to students that you are going to give them three minutes to see how many different displays they can produce using Animals Starter File. Invite them to be playful - to click buttons and select from menu options to see what they can produce. Notice that some menu icons only appear under specific conditions. (If students need a bit of encouraging, you might prod them to make scatterplots and histograms.)
When time is up, invite students to share.
-
What did you discover?
-
When did the
configurationmenu appear (the one that looks like a stacked bar chart)?-
When there is another possible configuration of the data. For instance, when dots can be fused into bars, we see this menu.
-
-
When did the
measuremenu appear (the one that looks like a ruler)?-
This menu appears when there is an opportunity to change what is shown along with the points - for instance, connecting lines or calculating the count. Histograms and boxplots appear alongside an existing display, so they appear on the
measuremenu.
-
Explain that CODAP is designed to be student-friendly and that the interface encourages guesswork… but that we can save some time by being a bit more strategic.
Investigate
Now that they have had a chance to explore freely, students are ready to develop a methodical approach to creating displays. First, demonstrate how to create a bar chart showing the sex breakdown of the animals. To do this, model asking yourself three important questions (below) in order to build a bar chart in CODAP.
We’re going to complete Practice Plotting together. To make a dot plot showing the sex of animals from the shelter, we ask a series of important questions:
-
Which Column / Attributes on which axes?
-
Sex belongs on the either axis.
-
-
What Type of Data?
-
Male, female, and hermaphrodite are all categories. The chart will display categorical data.
-
-
What Configuration?
-
CODAP initially creates a dot plot of the data, so no special configuration is needed.
-
Focus on supporting students in learning how to pose productive questions when looking at data. Invite students to repeat the process you just modeled as they create a bar chart (Q2 on the same page) that shows the species of animals from the shelter.
-
With your partner, complete Practice Plotting (2) and Practice Plotting (3).
-
Finally, summarize what you’ve observed about what display goes with what kind of data on the Data Displays Organizer. It may help to refer back to the "Practice Plotting" worksheets that you just completed. The "Notes" column can be filled in today, or you can add to it in future classes to use a reference.
Students will want to take thorough notes on Data Displays Organizer, as they can use it as a resource and reference in future lessons.
Common Misconceptions
There are many possible misconceptions about displays that students may encounter here. But that’s ok! Understanding all those other plots is not a learning goal for this lesson. Rather, the goal at this stage is to have them build familiarity and confidence with the CODAP tool and how it makes data displays.
Synthesize
-
What displays did you find that work with just one column of data?
-
dot plots, bar charts, histograms and box plots
-
-
What displays did you find that work with more than one column of data?
-
scatter plots and lr-plots
-
-
What displays did you find that work with categorical data?
-
dot plots and bar charts
-
-
What displays did you find that work with quantitative data?
-
histograms, box plots, scatterplots, and lr-plots
-
Today you’ve added more data displays to your toolbox. You can create dot plots and bar charts to visually display categorical data, and you’ve developed a general approach to guide you as you create other displays.
These materials were developed partly through support of the National Science Foundation, (awards 1042210, 1535276, 1648684, 1738598, 2031479, and 1501927).  Bootstrap by the Bootstrap Community is licensed under a Creative Commons 4.0 Unported License. This license does not grant permission to run training or professional development. Offering training or professional development with materials substantially derived from Bootstrap must be approved in writing by a Bootstrap Director. Permissions beyond the scope of this license, such as to run training, may be available by contacting contact@BootstrapWorld.org.