(Also available in CODAP)
Students practice creating subsets and think about why it might sometimes be useful to answer questions about a dataset through the lens of specific subsets.
Lesson Goals |
Students will be able to…
|
Student-facing Lesson Goals |
|
Materials |
|
Preparation |
|
- grouped sample
-
a non-random subset of individuals chosen from a larger set, where the individuals belong to a specific group
🔗Problems with a Single Population 10 minutes
Overview
This activity is all about grouped samples: Students make a bunch of subsets from the Animals Dataset, and see how each subset might answer the same question differently.
Launch
When looking at a scatter plot of our animals, it looks like the amount an animal weighs may have something to do with how long it takes to be adopted.
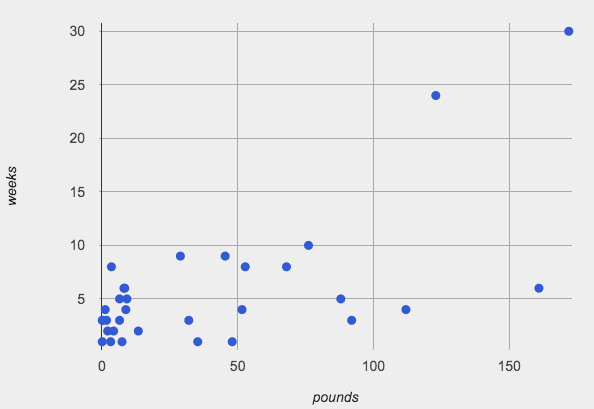 🖼Show image
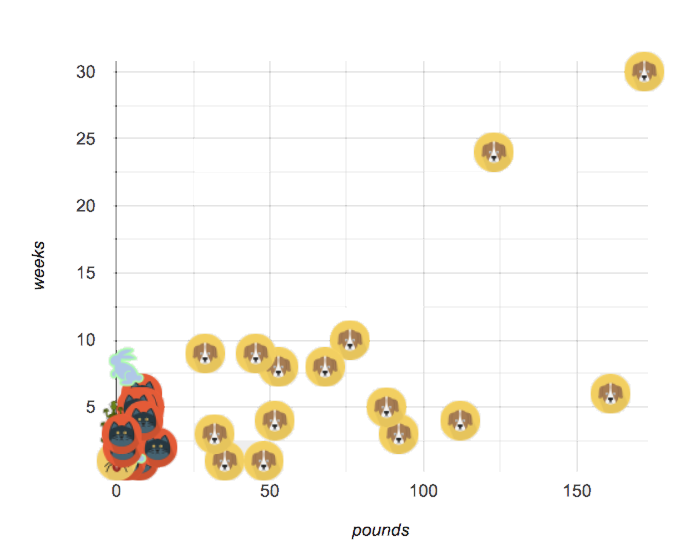
But if we label the dots by animal, we notice every data point after 25 pounds belongs to a dog from the shelter! The cats are all clumped together in the lower weight range, making it hard to see how weeks to adoption may relate to a cat’s weight.
Investigate
Divide the class into groups of 3-4, with one student identified as the "reporter".
-
Looking at this scatterplot, does it make sense to analyze all the animals together? Why or why not?
-
Are there some questions where it would be important to break up the population into species-specific populations? What are they?
-
Are there some questions where it would be important to keep the whole population together? What are they?
Synthesize
Have the reporters share their findings with the class.
Imagine that you’ve been handed a dataset from a country where half the people are wealthy and have access to amazing medical care, and the other half are poor and have no healthcare. If we took a random sample of the population as a whole, we might think that they are generally middle-income and have average health. But if we ask the same question about the two groups separately, we would discover inequality hiding in plain sight!
🔗Grouped Samples 20 minutes
Launch
Ultimately, it might make more sense to ask certain questions about "just the cats" or "just the dogs". Averaging every animal together will give us an answer, but they may not be useful answers.
Sometimes important facts about samples get lost if we mix them with the rest of the population!
Data Scientists define grouped samples of datasets, breaking them up into sub-groups that may be helpful in their analysis.
Earlier, you learned how to define values in Pyret. We can define Numbers, Strings, Images, and even rows:
name = "Flannery"
age  = 16
logo = star(50, "solid", "red")
sasha= animals-table.row-n(0)
Let’s use this skill to define Tables…
Investigate
We already know how to define values, and how to filter a dataset. So let’s put those skills together to define a grouped sample of the dogs in the shelter:
dogs = animals-table.filter(is-dog)A “kitten” is an animal who is a cat and who is young. How would you define a table of just kittens?
-
Turn to Grouped Samples from the Animals Dataset, and see what code will compute whether or not an animal is a kitten.
-
Can you fill in the code for the other grouped samples?
-
When you’re done, type these definitions into the Definitions Area.
-
Make a bar chart showing the distribution of
sexin thekittenssubset , by typingbar-chart(kittens, "sex"). -
Make bar charts showing the
sexcolumn for every grouped sample. Which one best represents the distribution of species for the whole population? Why?
Synthesize
Debrief with students. Thoughtful question: how could we filter and sort a table? How can we combine methods?
🔗Displaying Samples 20 minutes
Overview
Students revisit the data display activity, now using the samples they created.
Launch
Making grouped and random samples is a powerful skill to have, which allows us to dig deeper than just making charts or asking questions about a whole dataset. Now that we know how to make subsets, we can make much more sophisticated displays!
Investigate
Complete Displaying Data, using what you’ve learned about samples to make more sophisticated data displays.
Synthesize
Were any of the students' displays interesting or surprising? Given a novel question, can students identify what helper functions they would need to write?
These materials were developed partly through support of the National Science Foundation,
(awards 1042210, 1535276, 1648684, and 1738598).  Bootstrap by the Bootstrap Community is licensed under a Creative Commons 4.0 Unported License. This license does not grant permission to run training or professional development. Offering training or professional development with materials substantially derived from Bootstrap must be approved in writing by a Bootstrap Director. Permissions beyond the scope of this license, such as to run training, may be available by contacting contact@BootstrapWorld.org.