Students select a real world dataset to investigate for the remainder of the course. They begin their analysis by identifying categorical and quantitative columns, and defining a few random and logical subsets.
Lesson Goals |
Students will be able to…
|
Student-facing Lesson Goals |
|
Materials |
|
Preparation |
|
Supplemental Resources |
🔗The Data Cycle 20 minutes
Overview
Students learn about the Data Cycle, which helps them get situated in the process of analyzing the datasets they will select in this lesson. They browse through the library of provided datasets, and choose one they want to work with. NOTE: the selection process can also be done as a homework assignment, if all students have internet access at home.
Launch
Zoom out a little and help students reflect on what they’ve done so far. Students began by exploring the Animals Dataset, formulating questions and exploring them with data displays. This led to further questions, making subsets, and asking more questions.
 🖼Show image
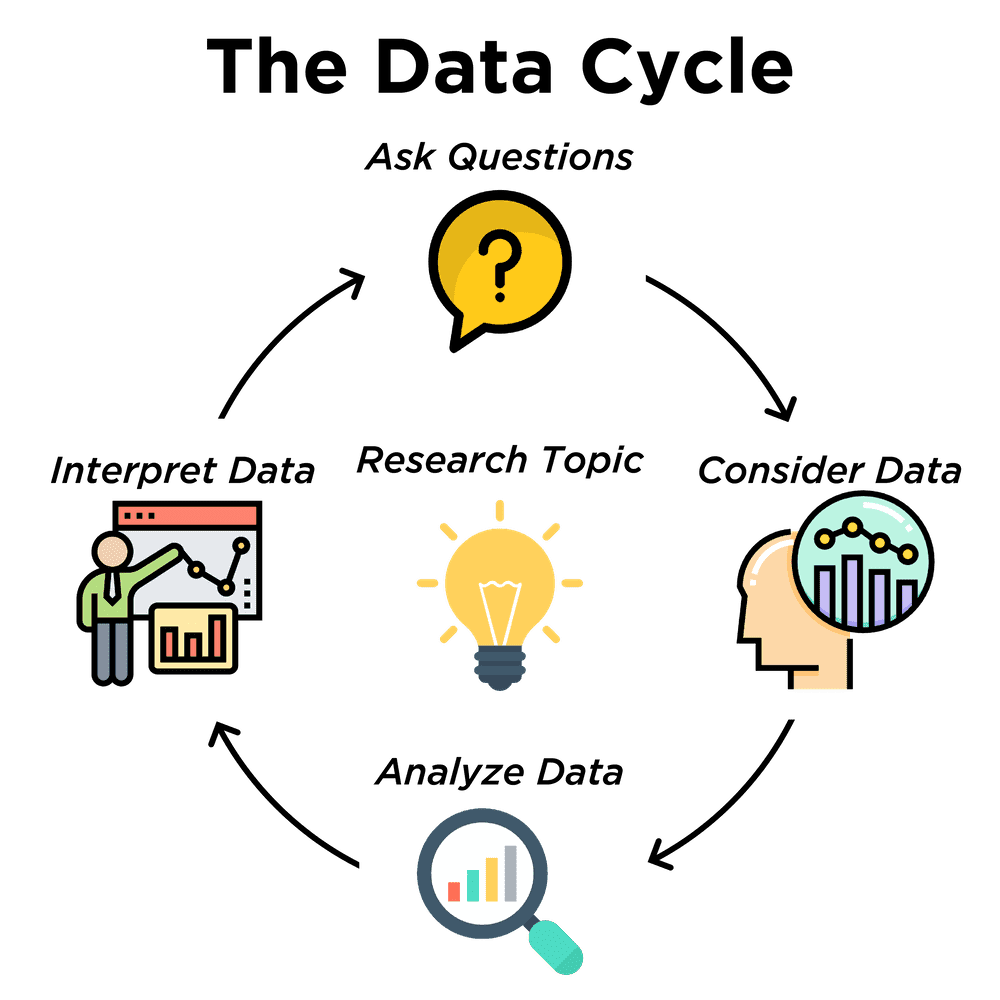
The Data Cycle[*] is a roadmap, which helps guide us in the process of data analysis.
🖼Show image
The Data Cycle[*] is a roadmap, which helps guide us in the process of data analysis.
(Step 1) We start by Asking Questions - statistical questions that can be answered with data.
(Step 2) Then we Consider Data. This could be done by conducting a survey, observing and recording data, or finding a dataset that meets our needs.
(Step 3) Then it’s on to Analyzing the Data, in which we produce data displays and new tables of filtered or transformed data in order to identify patterns and relationships.
(Step 4) Finally, we Interpret the Data, in which we answer our questions and summarize the results. As we’ve already seen from the Animals Dataset, these interpretations often lead to new questions….and the cycle begins again.
Explain to students that they will now select a dataset for them to work with for the remainder of the course. Make sure they understand that it genuinely has to be something they are interested in - their engagement with the data is critical to engaging with the class.
Students can also find their own dataset, and use this Blank Starter file. See this tutorial video for help importing your own data into Pyret.
Students must have at least 2 questions that are both interesting and answerable using their dataset.
Investigate
Have students choose a dataset that is interesting to them! They should have at least two questions that the dataset can help them answer, and write them on What’s on your mind?.
Looking for a shorter list? We’ve starred a few good beginner datasets.
The Environment & Health
- Global Waste by Country 2019
- World Cities' Proximity to the Ocean
- Earthquakes
- Air Quality, Pollution Sources & Health in the U.S.
- Health by U.S. County
- COVID in the U.S. by County
- Arctic Sea Ice
Politics
- Countries of the World
- Gerry Mandering
- Marijuana Laws & Arrests by State 2018
- LAPD Arrests 2010-2019
- NYPD Stop, Search & Frisk 2019
- Refugees 2018
- State Demographics
- U.S. Income
- U.S. Jobs
- U.S. Presidents
- U.S. Voter Turnout 2016
Sports
- Esports Earnings
- MLB Hitting Stats
- ★NBA Players
- NFL Passing
- NFL Rushing
Entertainment
- ★Movies
- IGN Video Game Reviews
- International Exhibition of Modern Art
- North American Pipe Organs
- Pokemon
- Music
Education
- College Majors
- U.S. Colleges 2019-2020
- ★R.I. Schools
- Evolution of College Admissions in California
Nutrition
- Soda, Coffee & Other Drinks
- Fast Food Nutrition
Open the Research Paper template, and save a copy.
-
Students fill in their first and last name(s), the teacher name on the first page of the Research Paper.
-
Students should also copy the link to the dataset (spreadsheet), and paste it into the first page of the Research Paper.
-
Students should click "Publish" in their Pyret Starter File, then copy/paste the resulting link into the first page of the Research Paper.
Synthesize
Have students share their datasets and their questions.
For the rest of this course, students will be learning new programming and Data Science skills, practicing them with the Animals Dataset and then applying them to their own data.
🔗Exploring Your Dataset flexible
Overview
Students apply what they’ve learned about describing and making subsets from the Animals Dataset to their own dataset. Note: this activity can be done briefly as a homework assignment, but we recommend giving students an additional class period to work on this.
Launch
By now you’ve already learned what to do when you approach a new dataset. With the Animals Dataset, you first read the data itself, and wrote down your Notice and Wonders. You described the columns in the Animals Dataset, identifying which were categorical and which were quantitative, and whether they were Numbers, Strings, Booleans, etc. Finally, you used the Design Recipe and table methods to make random and logical subsets.
Now, you’re doing to do the same thing with your own dataset.
Investigate
-
Have students look at the spreadsheet for their dataset. What do they Notice? What do they Wonder? Have them complete My Dataset, making sure to include at least two questions that _can be answered by their dataset and one that cannot.
-
In the Definitions Area, students use
random-rowsto define at least three tables of different sizes:tiny-sample,small-sample, andmedium-sample. -
In the Definitions Area, students use
.row-nto define at least three values, representing different rows in your table. -
Have students think about subsets that might be useful for their dataset. Name these subsets and write the Pyret code to test an individual row from your dataset on Samples from My Dataset.
-
Students should fill in My Dataset portion of their Research Paper.
-
Students should fill in Categorical Visualizations portion of their Research Paper, by generating pie and bar charts for their dataset and explaining what they show.
Turn to The Design Recipe, and use the Design Recipe to write the filter functions that you planned out on Samples from My Dataset. When the teacher has checked your work, type them into the Definitions Area and use the .filter method to define your new sample tables.
Choose one categorical column from your dataset, and try making a bar or pie-chart for the whole table. Now try making the same display for each of your subsets. Which is most representative of the entire column in the table?
Synthesize
Have students share which subsets they created for their datasets.
[*] From the Mobilizing IDS project and GAISE
These materials were developed partly through support of the National Science Foundation,
(awards 1042210, 1535276, 1648684, and 1738598).  Bootstrap by the Bootstrap Community is licensed under a Creative Commons 4.0 Unported License. This license does not grant permission to run training or professional development. Offering training or professional development with materials substantially derived from Bootstrap must be approved in writing by a Bootstrap Director. Permissions beyond the scope of this license, such as to run training, may be available by contacting contact@BootstrapWorld.org.