Referenced from lesson Linear Regression
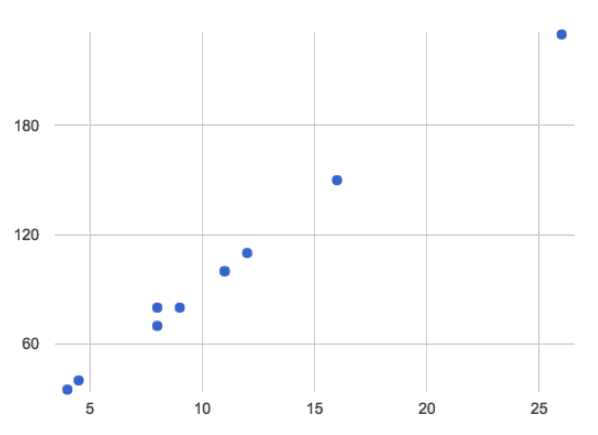
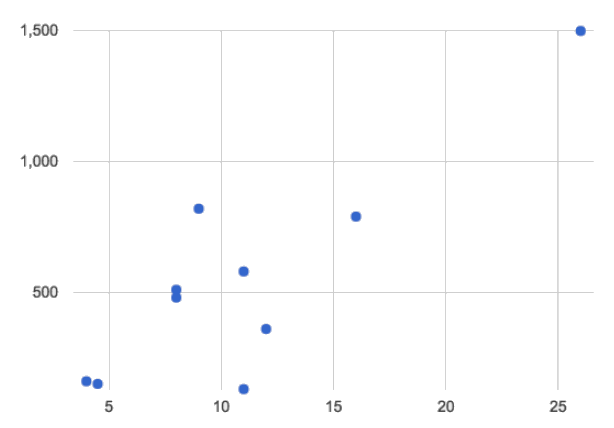
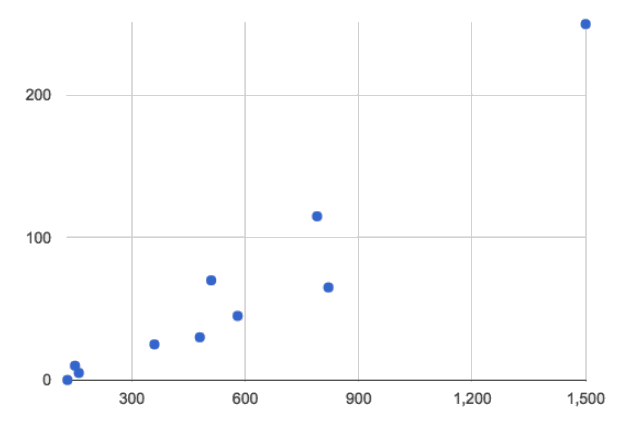
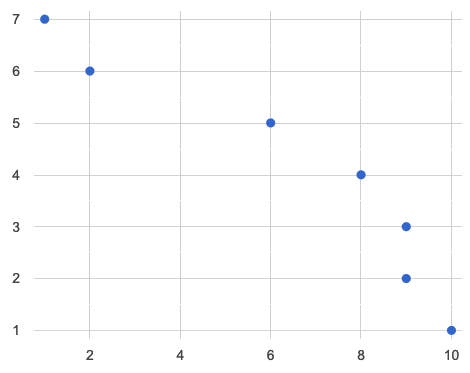
For each of the scatter plots below, draw a predictor line that seems like the best fit. Describe the correlation in terms of Direction and Strength, then estimate the r-value.
A |
|
|||||||||||||
B |
|
|||||||||||||
C |
|
|||||||||||||
D |
|
These materials were developed partly through support of the National Science Foundation,
(awards 1042210, 1535276, 1648684, and 1738598).  Bootstrap:Data Science by Emmanuel Schanzer, Nancy Pfenning, Emma Youndtsmith, Jennifer Poole, Shriram Krishnamurthi, Joe Politz, Ben Lerner, Flannery Denny, and Dorai Sitaram with help from Eric Allatta and Joy Straub
is licensed under a
Creative Commons 4.0 Unported License.
Based on a work at www.BootstrapWorld.org.
Permissions beyond the scope of this license may be available by contacting
schanzer@BootstrapWorld.org.
Bootstrap:Data Science by Emmanuel Schanzer, Nancy Pfenning, Emma Youndtsmith, Jennifer Poole, Shriram Krishnamurthi, Joe Politz, Ben Lerner, Flannery Denny, and Dorai Sitaram with help from Eric Allatta and Joy Straub
is licensed under a
Creative Commons 4.0 Unported License.
Based on a work at www.BootstrapWorld.org.
Permissions beyond the scope of this license may be available by contacting
schanzer@BootstrapWorld.org.