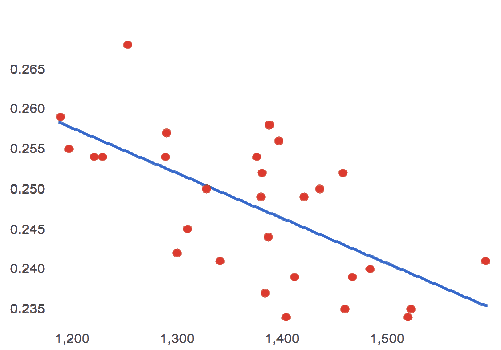
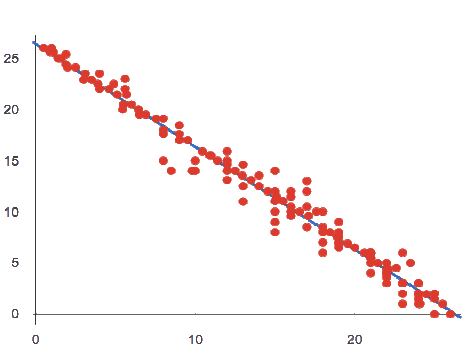
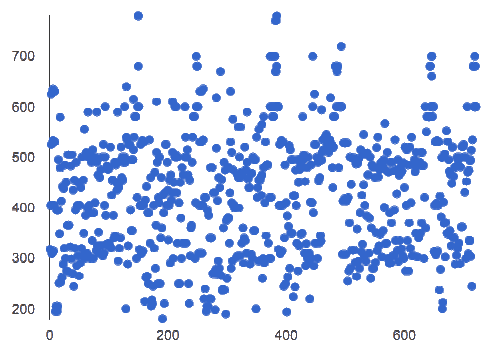
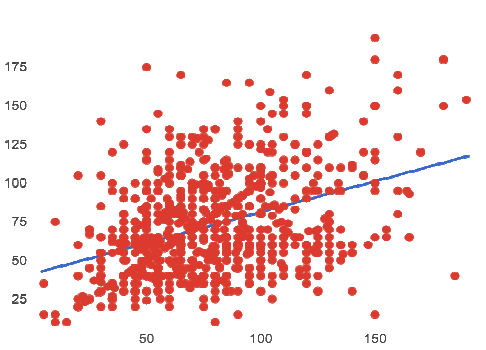
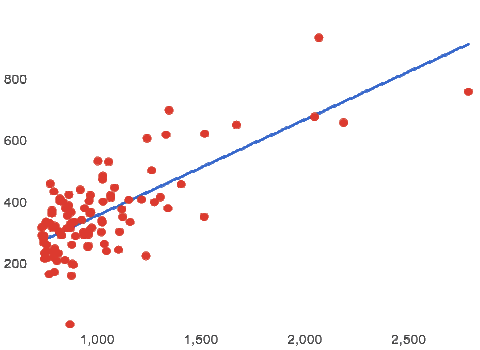
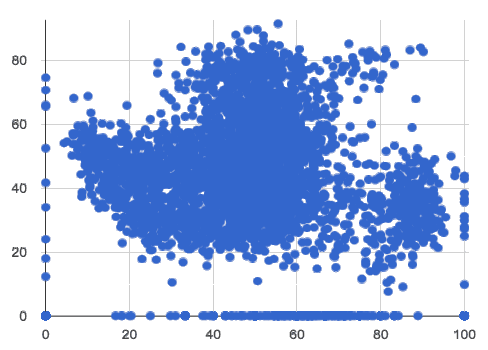
What do your eyes tell you about the Form and Direction of the data? If the form is linear, approximate the r-value.
Reminder:
-
−1 is the strongest possible negative correlation, and +1 is the strongest possible positive correlation
-
0 means no correlation
-
±0.65 or ±0.70 or more is typically considered a "strong correlation"
-
±0.35 to ±0.65 is typically considered “moderately correlated”
-
Anything less than about ±0.25 or ±0.35 may be considered weak
A |
|
B |
|
||||||||
C |
|
D |
|
||||||||
E |
|
F |
|
These materials were developed partly through support of the National Science Foundation, (awards 1042210, 1535276, 1648684, 1738598, 2031479, and 1501927).  Bootstrap by the Bootstrap Community is licensed under a Creative Commons 4.0 Unported License. This license does not grant permission to run training or professional development. Offering training or professional development with materials substantially derived from Bootstrap must be approved in writing by a Bootstrap Director. Permissions beyond the scope of this license, such as to run training, may be available by contacting contact@BootstrapWorld.org.
