 Data Science is all about asking questions of data. Sometimes the answer is easy to compute. Sometimes the answer to a question is already in the dataset - no computation needed. And sometimes the answer just sparks more questions! Data Scientists ask a lot of questions, and each one adds a chapter to the story of their research. Even if a question is a "dead-end", it’s valuable to share what the question was and what work you did to answer it!
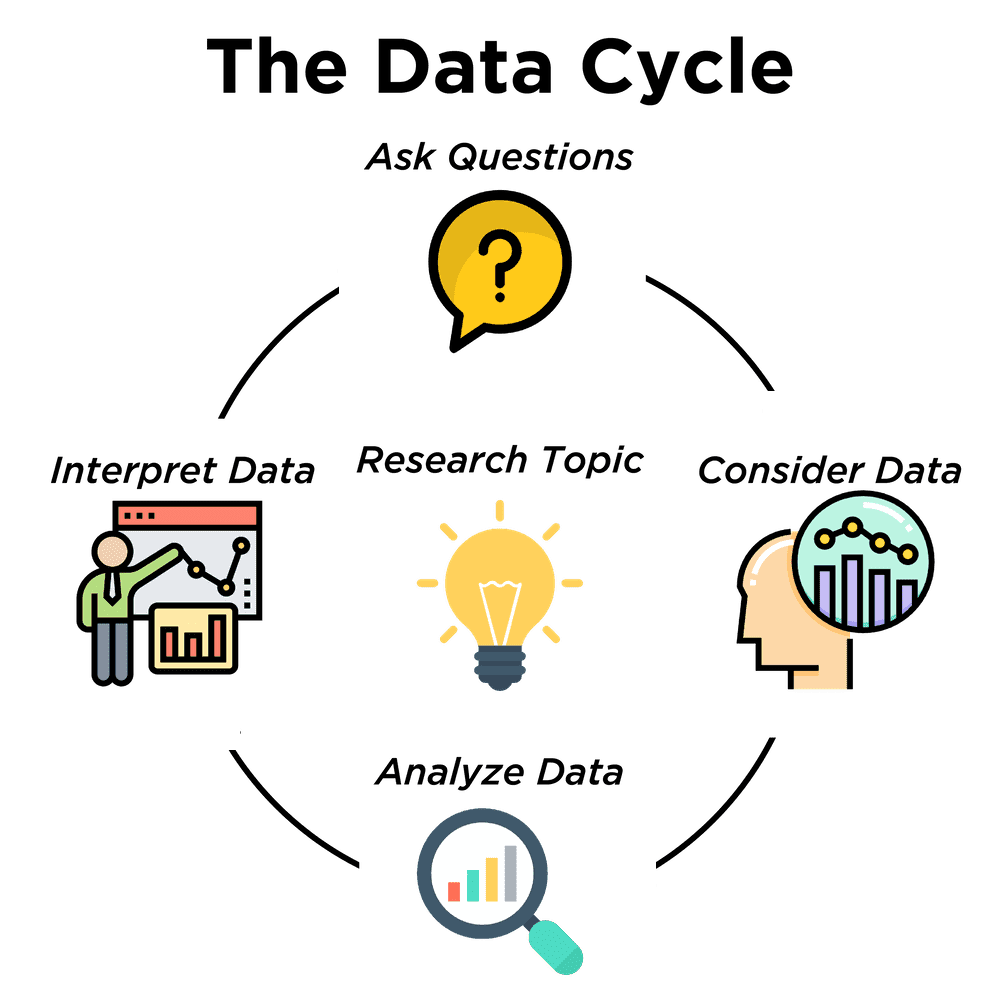
We start by Asking Questions - questions that can be answered with data. It’s useful to think of all questions as falling into four categories:
-
Lookup questions can be answered simply by looking up a single value in the table. Examples of lookup questions might be “How many legs does Felix have?” or "What species is Sheba?"
-
Arithmetic questions can be answered by computing an answer within a single column. Examples of arithemetic questions might be “How much does the heaviest animal weigh?” or “What is the average age of animals from the shelter?”
-
Statistical questions are where things get interesting! The answers are never black-and-white. If we asked, "How old are animals at the shelter?" we could report back the average age, the age that shows up most frequently or the range of the ages. There are also some statistical questions that deal with relationships between two columns: “Do cats tend to be adopted faster than dogs?” or “Are older animals heavier than young ones?”
-
Questions we can’t answer are pretty common, too! We might wonder where the animal shelter is located, or what time of year the data was gathered! But the data in the table won’t help us answer that question, so as Data Scientists we might need to do some research beyond the data. And if nothing turns up, we simply recognize that there are limits to what we can analyze.
Next, we Consider Data. This could be done by conducting a survey, observing and recording data, or finding a dataset that meets our needs. Since our data is contained in a table, it’s useful to start by asking two questions:
-
What rows do we care about? - Is it all the animals? Just the lizards?
-
What columns do we need? - Are we examining the ages of the animals? Their weights?
Then, we Analyze the Data, by producing data displays and new tables of filtered or transformed data and using them to identify patterns and relationships.
-
Are we making a pie chart? A bar chart? Something else?
Finally, we Interpret the Data, by answering our questions and summarizing the results. As we’ve already seen from the Animals Dataset, these interpretations often lead to new questions… and the cycle begins again.
These materials were developed partly through support of the National Science Foundation, (awards 1042210, 1535276, 1648684, 1738598, 2031479, and 1501927).  Bootstrap by the Bootstrap Community is licensed under a Creative Commons 4.0 Unported License. This license does not grant permission to run training or professional development. Offering training or professional development with materials substantially derived from Bootstrap must be approved in writing by a Bootstrap Director. Permissions beyond the scope of this license, such as to run training, may be available by contacting contact@BootstrapWorld.org.