Referenced from lesson Threats to Validity
Every claim below is wrong! Your job is to figure out why by looking at the data.
| Data | Claim | What’s Wrong | |
|---|---|---|---|
1 |
The average player on a basketball team is 6′1″. |
“Most of the players are taller than 6 feet.” |
|
2 |
Linear regression found a positive correlation (r=0.18) between people’s height and salary. |
“Higher salaries can make people taller!.” |
|
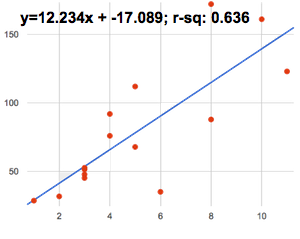
3 |
“According to the predictor function indicated here, the value on the x-axis will predict the value on the y-axis 63.6% of the time.” |
||
4 |
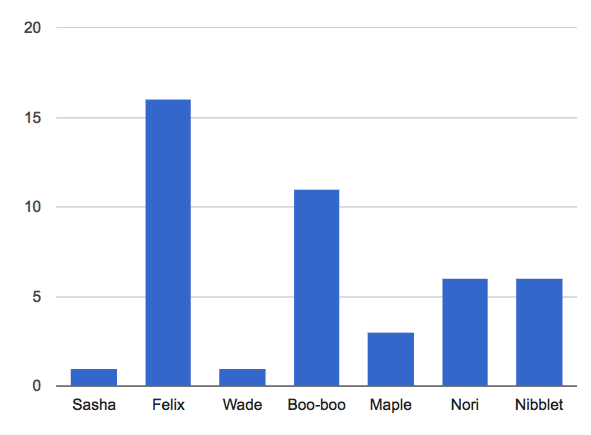
Bar Chart of Pet Ages
|
“According to this bar chart, Felix makes up a little more than 15% of the total ages of all the animals in the dataset.” |
|
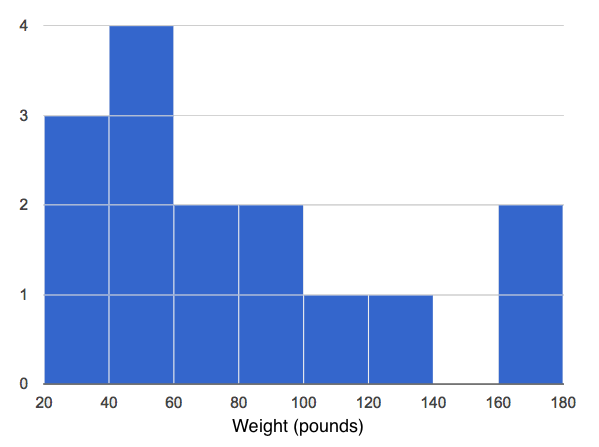
5 |
“According to this histogram, most animals weigh between 40 and 60 pounds.” |
||
6 |
Linear regression found a negative correlation (r= -0.91) between the number of hairs on a person’s head and their likelihood of owning a wig. |
“Owning wigs causes people to go bald.” |
These materials were developed partly through support of the National Science Foundation,
(awards 1042210, 1535276, 1648684, and 1738598).  Bootstrap:Data Science by Emmanuel Schanzer, Nancy Pfenning, Emma Youndtsmith, Jennifer Poole, Shriram Krishnamurthi, Joe Politz, Ben Lerner, Flannery Denny, and Dorai Sitaram with help from Eric Allatta and Joy Straub
is licensed under a
Creative Commons 4.0 Unported License.
Based on a work at www.BootstrapWorld.org.
Permissions beyond the scope of this license may be available by contacting
schanzer@BootstrapWorld.org.
Bootstrap:Data Science by Emmanuel Schanzer, Nancy Pfenning, Emma Youndtsmith, Jennifer Poole, Shriram Krishnamurthi, Joe Politz, Ben Lerner, Flannery Denny, and Dorai Sitaram with help from Eric Allatta and Joy Straub
is licensed under a
Creative Commons 4.0 Unported License.
Based on a work at www.BootstrapWorld.org.
Permissions beyond the scope of this license may be available by contacting
schanzer@BootstrapWorld.org.